kW vs. kWh Explained: How Clipping Impacts Your Solar Monitoring Data
Understanding the difference between kW (kilowatts) and kWh (kilowatt-hours) is important when reviewing your solar system’s production. Knowing how clipping occurs and what to expect in your monitoring data can help you better interpret how your system performs throughout the year.
Clipping
A grid-tied solar system’s power is quantified in kilowatts (kW) on both the AC and the DC side of the system.. The kilowatt hour (kWh) is a unit of energy, resulting from a certain level of power over a period of time (Kilowatts over hours = kilowatt hours)).
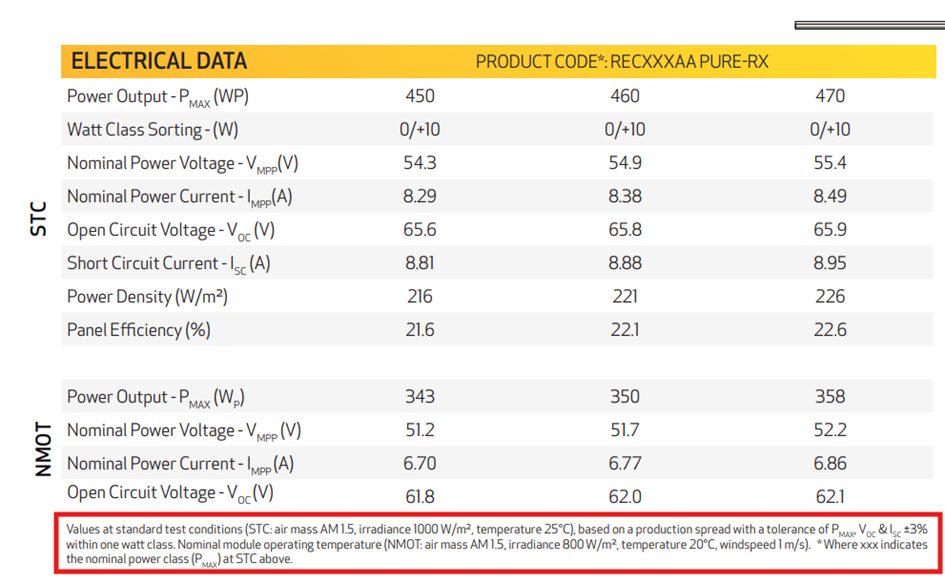
For example, if you have 22 solar modules rated at 460W each, that equals 10,120W or 10.12kW DC. This means your solar panels can produce 10.12kW of power if they operate under the same test conditions used in the lab and if sunlight hits the panels perfectly perpendicular. If they operated in the lab for one hour at full power, they would generate energy in the amount of 10.12kWh
In DC, MD, or VA, we never meet those exact conditions, so the solar panels will always produce less power than the kW DC size indicates.
Major Factors That Reduce Production
- Azimuth (orientation to the sun): A fully south direction is 180°, and north is 0°.
- Tilt angle: Affects the angle of sunlight. Ideally around 35°.
- Shading, weather, and temperature: All influence overall performance.
Even with the perfect tilt, orientation, and no shading, the latitude and temperature of our region affects the system’s performance.
When we estimate production for a new design, we account for these efficiency losses. That means the production values presented by our sales team represent realistic system performance, not lab conditions.
DC vs. AC Power
The second “kW” value refers to the AC (alternating current) capacity. Power from solar panels is produced in DC (direct current) and must be converted to AC for your home or building.
The AC kW size represents the maximum amount of power the inverter or microinverter can convert, and it is usually intended to be lower than the DC kW size.
For example, if your solar panels have a 10kW DC system size, they might produce a maximum of 8 to 8.5kW DC under ideal conditions. If connected to a 7.6kW AC inverter, only 7.6kW can be converted to usable AC power, and the rest is lost.
Why Install a Smaller Inverter?
It may seem counterintuitive to install a smaller inverter than the panels’ potential output, but this design is intentional. The reason is cost efficiency.
All equipment after the inverter is sized according to its maximum output. A larger inverter would require larger wires, conduits, breakers, and other equipment, all of which increase cost.
In most cases, the savings of a slightly smaller inverter and associated materials outweighs the value of the small amount of energy lost. Most of the year, your system does not produce enough power to reach the inverter’s limit.
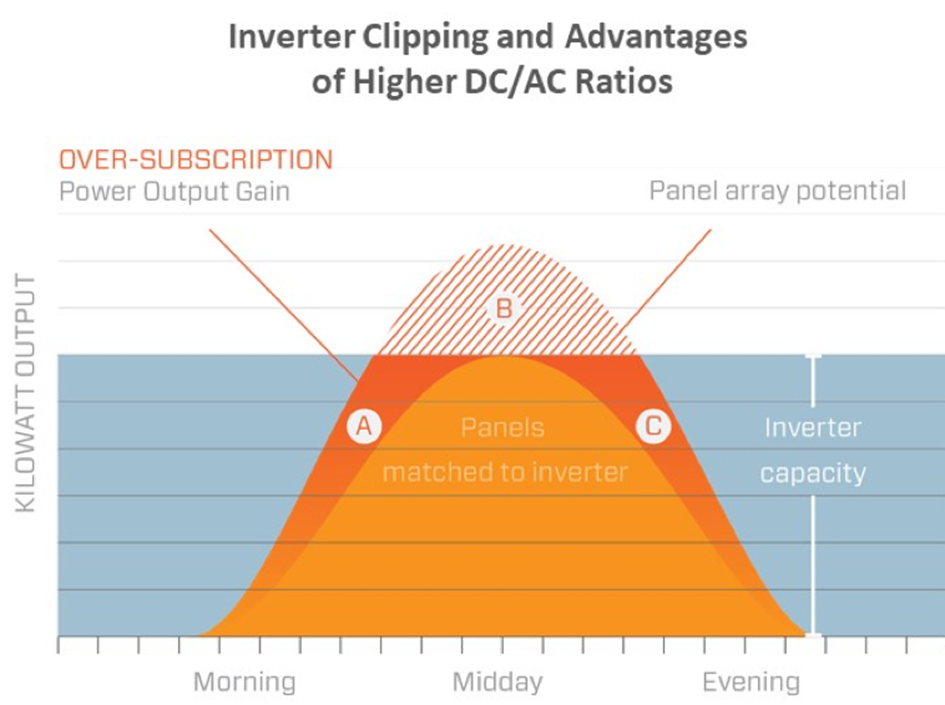
Solar production is zero at night, lower on cloudy or winter days, and occasionally exceeds the inverter’s capacity only for a few hours per year. Those few instances are called clipping.
Clipping represents a minimal, acceptable loss that helps balance system cost and performance.
Monitoring Your System
Once your project is installed, you’ll have access to a monitoring app to view your system’s production. A common question is:
“Why isn’t my 10kW system producing 10kW?”
As mentioned in the clipping section, your system experiences natural losses and will never produce 10kWh of energy in a single hour.
A 10kW system refers to the capacity (potential) of your equipment in lab conditions, not its constant power output. The panels’ production depends on sunlight intensity, weather, and time of year, among other things.
Typical Seasonal Production Patterns
- Snowy or overcast days: May show 0kWh if panels are covered or shaded.
- Fall and winter (October to April): Average around 10kWh per day.
- Summer: Can reach 40kWh or more on clear, sunny days.
At Solar Energy Services, we use advanced design software like Aurora, Helioscope, and Scanifly to model your site’s conditions. These tools use historical weather data, shading analysis, and orientation to calculate actual expected annual production.
Your monitoring app may show daily fluctuations, but your annual total should align closely with the production estimate provided during your system design.
Your solar system’s production will vary day to day and season to season. Clipping is a normal and intentional part of solar design that balances cost, efficiency, and real-world performance.
By understanding how kW, kWh, and system conditions interact, you can feel confident that your system is operating as designed, maximizing your energy savings and providing reliable, long-term performance.